Geeky But Useful Demographic Data
Great post from guest blogger Tim Trimbath!
Whidbey is changing, and always has been. Data can be dull, but it can be surprising how many times people talk about how many people are on the island, a few facts about who is here, and how expensive housing is. Thanks to the Economic Development Council for providing the equally geeky title; “Island County Demographics Report Updated July 2022“. To many, data sounds dull but if you’re an islander, you’re in there somewhere. You aren’t dull, are you?

There are 65,824 Whidbey Islanders. One number mentioned is higher, like 87,700, but that includes Camano. That’s almost enough to fill the stands for a Seahawks game (~68,740). Finally, a place for us to hold a party. In Island County we could spread out to 421 people per square mile.

We’re spread out, of course: 38,609 (north Whidbey), 13,179 (central Whidbey), 14,036 (south Whidbey). No surprise, the Oak Harbor area has the most (~59%). The rest of the island means fewer people but more room.

The biggest difference may be age. North Whidbey’s median age is 31.3 years. Add more than 25 years and get a generational difference because central Whidbey’s median age is 58.6 and south Whidbey hits 57.5. Does that make you feel young or old?

South Whidbey stands out by not being as balanced between women and men with 53.4% of the population as women; while the rest of the island is near even 49.5% female / 50.5% male. That may also help explain why the island has a higher percentage of women-owned business. (Another data point to update, but not right now.)

How’s the living? The further south you go, the higher the home values. That’s not the same as list prices and sale prices, but the trend is obvious: north $316,200, central $404,100, and south $471,700. (Side note: September 8 at 2PM there will be an updated presentation about Whidbey Island real estate and affordability trends at Freeland Library. Hmm. Gotta get to work on that.)

The neighborhoods are potentially quieter on the south end simply because so many of the houses are vacant, possibly because so many are vacation homes. North Whidbey is close to the national average with only 10% vacant, but central has 24% vacancy and south Whidbey has 38% vacant. That’s up from 27%. VRBOs, Rural Distancing perhaps?

Household income rises too: north, $61,186; central, $75,694; south $82,421. Maybe that is because so many full-time workers on the south end commute to the mainland.
Put those last two data bits together, or actually divide the house prices by the income and get a measure of affordability. At least from that measure, north Whidbey is more affordable than either of the two other areas: 5.17 vs 5.34 vs 5.72.

But not everyone owns a house. Not everyone rents their place. North Whidbey is nearly split, 47% rent while 53% own. Central Whidbey is the most extreme with only 15% renting. South Whidbey is higher at 23%, but that’s still a lot of homeowners.
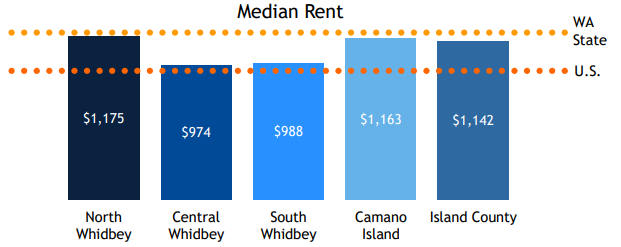
With housing prices and affordability indices like those it might be surprising that the highest rents are where housing is most affordable, $1,175 per month in the north end versus $974 and $988 for central and south Whidbey. It may be a case of supply and demand though as Oak Harbor certainly has a supply of people. Whether you can find a place is a separate story.
That’s enough data for now (and undoubtedly more than enough for some, but many may have quit reading earlier.) Maybe the information is useful, at least as trivia; but for some it will be important. Hopefully, it helps.
Thanks, EDC.
(Disclosure: I’m a broker at Dalton Realty, Inc. http://whidbeyrealtor.com/).
Original Link: https://aboutwhidbey.com/2022/08/06/geeky-but-useful-demographic-data/